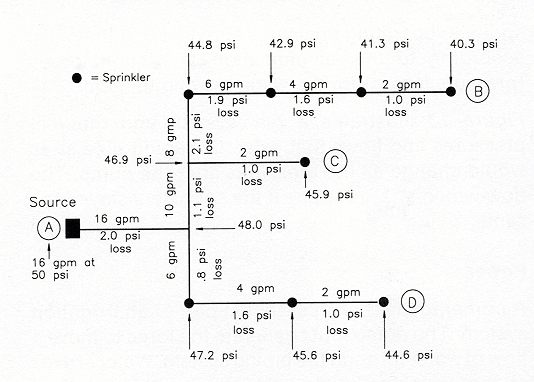
An example of a real sprinkler
system illustrates the discussion of flow, pressure, and friction loss.
 Real
Sprinkler System is an illustration of a small overhead sprinkler system
having eight sprinklers on three laterals. A pump supplies water. The illustration
does not illustrate the effect of elevation changes, but it does show:
-
Water pressure at the
pump and at each sprinkler,
-
Water flow rate in the
pipes within the system, and
-
Friction loss in psi
in sections of the pipeline (shown in parentheses).
Initial conditions:
-
Pump discharge pressure
= 50 psi
-
Pump discharge flow =
16 gpm
-
8 sprinklers discharge
an average of 2 gpm each
-
Given: All pipe diameters
are the same
Follow the water flow in the Real Sprinkler System diagram:
A pump discharges a flow rate of 16 gpm into the system; thus, 16 gpm must come
out somewhere. There are 8 sprinklers that average 2 gpm discharge at 45 psi.
Since flow = velocity x pipe cross-sectional area, think about what is happening
to flow and water velocity in each pipe segment (between sprinklers and tees).
Remember the pipe diameter stays constant throughout the system.
Start with 16 gpm flowing
to the first tee where flow splits to supply sprinklers in each direction. There
are 3 sprinklers to one side and 5 sprinklers to the other side. At the first
tee there is 48 psi pressure and the water flow is split 6 gpm to one side and
10 gpm to the other side. Continue from there to follow the water.
Follow the pressure:
The pump provides an operating pressure of 50 psi. There is no elevation change
so the pressure does not change due to elevation. There is flow in the pipes,
so there is friction as the water flows through the pipe. Some energy is lost
and the operating pressure gradually decreases.
Friction loss in the mainline
from the pump to the field was 2 psi, giving the 48 psi at the first tee. Follow
the pressures through the system and understand why the friction losses are
what they are and why the sprinkler operating pressures are what they are.
Note - remember the
connection between flow and pressure is water velocity. Remember the relationship
between velocity and friction loss. Keep this in mind when studying the irrigation
system in the example.
The discharge from the sprinklers
will vary with pressure. The following chart illustrates this.
Note the discharge
rate and throw distance vary with operating pressure.
2019 Sprinkler, # 7 Nozzle
| Pressure, psi |
30 |
35 |
40 |
45 |
50 |
| Flow, gpm |
1.59 |
1.74 |
1.87 |
2.00 |
2.12 |
| Diameter, ft |
76 |
77 |
78 |
79 |
80 |
 Real
Sprinkler System